Data visualization is a core skill and key component of being an environmental data scientist. More and more Bren School alumni are building careers focused on turning complex datasets into clear, compelling visuals that inform decisions, inspire action, and engage diverse audiences.
EDS 240: Data Visualization & Communication, a required course in the Master of Environmental Data Science (MEDS) program, prepares students to do exactly that. Taught by Bren instructor Sam Shanny-Csik, the course blends technical training with creative storytelling to help students transform environmental data into graphics that resonate.
“The goal,” Sam explains, “is to make data visualizations not only accurate, but also engaging, accessible, and impactful.”
Meet the Instructor
In a previous life, Sam was a marine ecologist who once felt “intimidated by all things data and programming.” She credits her supportive graduate school peers and co-learning communities, like R-Ladies Santa Barbara, for helping her see data science as a powerful and fun way to explore ecological research questions. These experiences are now what motivate Sam to find accessible and engaging ways to share technical skills with her own students.
A unique hallmark of her course is alternative grading, which shifts the focus away from chasing points and instead towards demonstrating skill mastery through feedback and the opportunity for iterative improvement on assignments.
As one student reflected:
“I really appreciated the alternative grading style as it took a lot of pressure off of me, as I tend to be a bit of a perfectionist. So without the number and letter grades on individual assignments, it allowed me to enjoy the work more and potentially create better visualizations in the process.”
Another noted:
“I can’t quite put my finger on it, but the tone of the course just really feels like it promotes easy learning. The expectations are certainly high, but are given in a way that allows room for growth at everyone’s particular pace… I really enjoy not having my performance pinned to a letter or number grade that can artificially inflate the stakes.”
Inside EDS 240
Students learn both the technical and design principles of effective data visualization, ranging from building plots in R using the {ggplot2} package, to exploring color theory, accessibility, data storytelling, and more. Sam also partners with Bren Teaching Faculty in Environmental Communication, Alex Phillips, who leads a graphic design workshop using industry-standard software. This added training helps students integrate programming and design skills to produce data products that are professional, visually compelling, and driven by a clear narrative. The course culminates with each student presenting a polished, data-driven infographic on an environmental topic of their choosing.
Student Work Spotlight
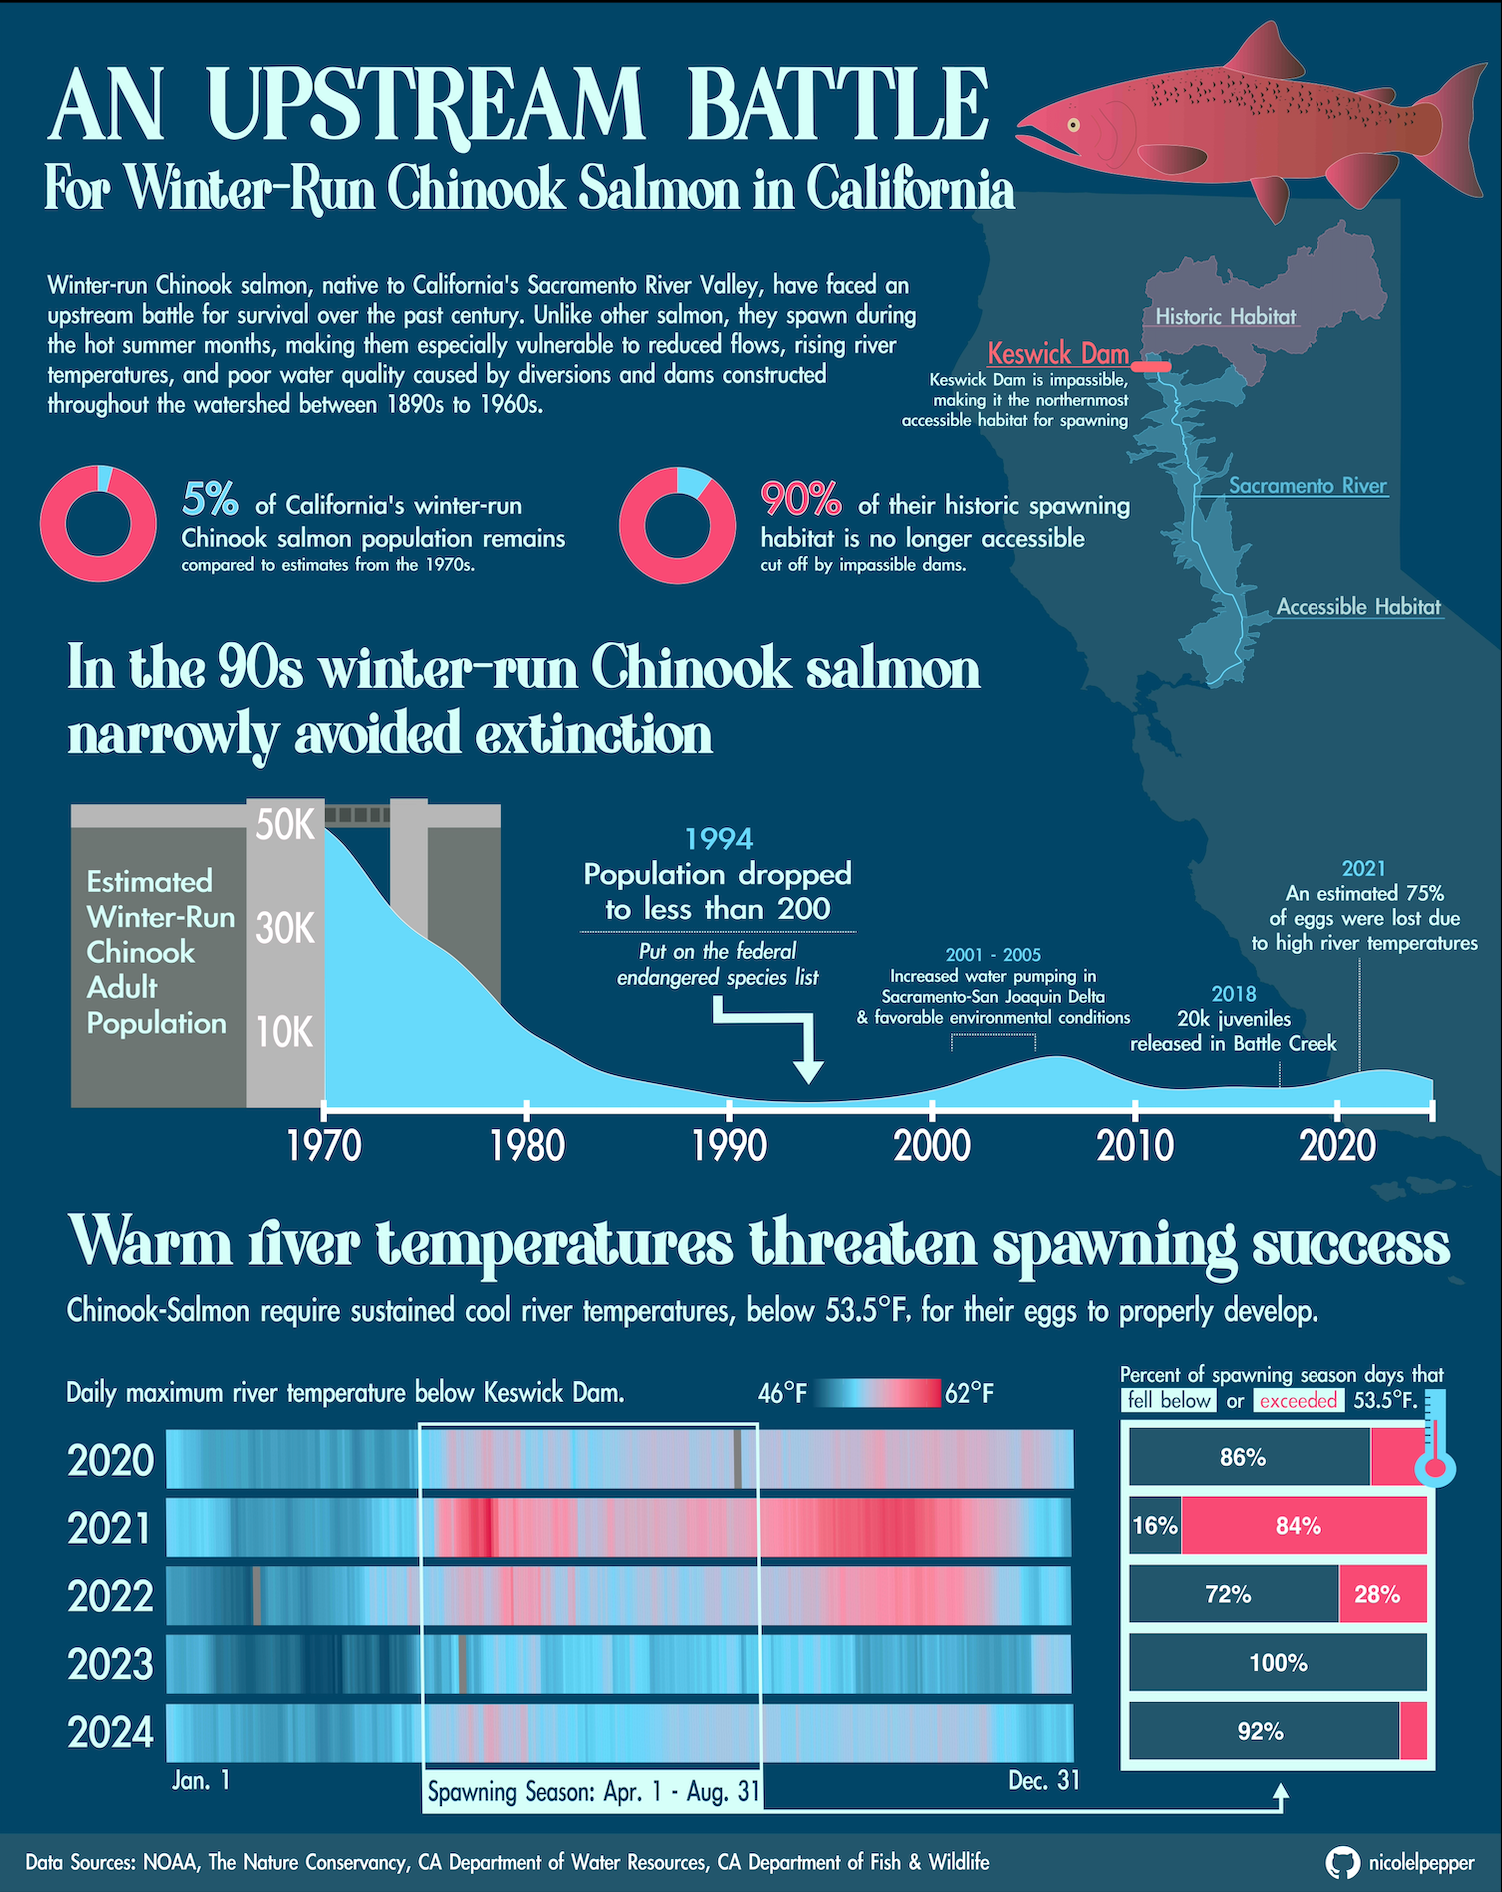
“An Upstream Battle” – Nicole Pepper (MEDS 2025)
For her final project in EDS 240, Nicole tells a story of the dramatic decline of winter-run Chinook salmon in California since the 1970s, and their resilience despite habitat loss, water diversions, and rising river temperatures. She strategically uses illustrations, colors, and text elements to carry readers through each of her visualizations.
“25 Years of Natural Disasters” – Jo Cardelle (MEDS 2025)
Jo decided to explore global patterns and impacts of natural disasters between 2000–2025 for her final project. We learn that while storms and floods make up the largest proportion of disasters, earthquakes have historically been the deadliest.

Why It Matters
Whether working in government, nonprofits, research, or industry, environmental data scientists increasingly need the skills to not only analyze data, but also communicate it clearly to diverse audiences. For some Bren alumni, data visualization and communication now make up their full-time professional role.
Courses like EDS 240 ensure that graduates leave with both the technical skillset and the creative confidence to share their work in ways that inspire understanding and action.
Interested in developing your own data storytelling skills?
Learn more about Bren’s Master of Environmental Data Science program and explore how courses like EDS 240 can prepare you for a career at the intersection of data, design, and environmental impact.
Admissions
Bren's MEDS program begins in Summer Quarter each year and students are enrolled full-time. The online application for graduate admission to UC Santa Barbara opens September 1 and closes December 15 annually. All admissions fees are waived for MEDS applicants who complete the fee waiver form before December 1, 2025.
Online Application Opens
Early September
Fee Waiver Deadline
December 1
Application Deadline
December 15
Admissions Decisions
March